Dashboard
The dashboard answers "what is the state of things" in one screen. It is the place to start the day, not the place to work.
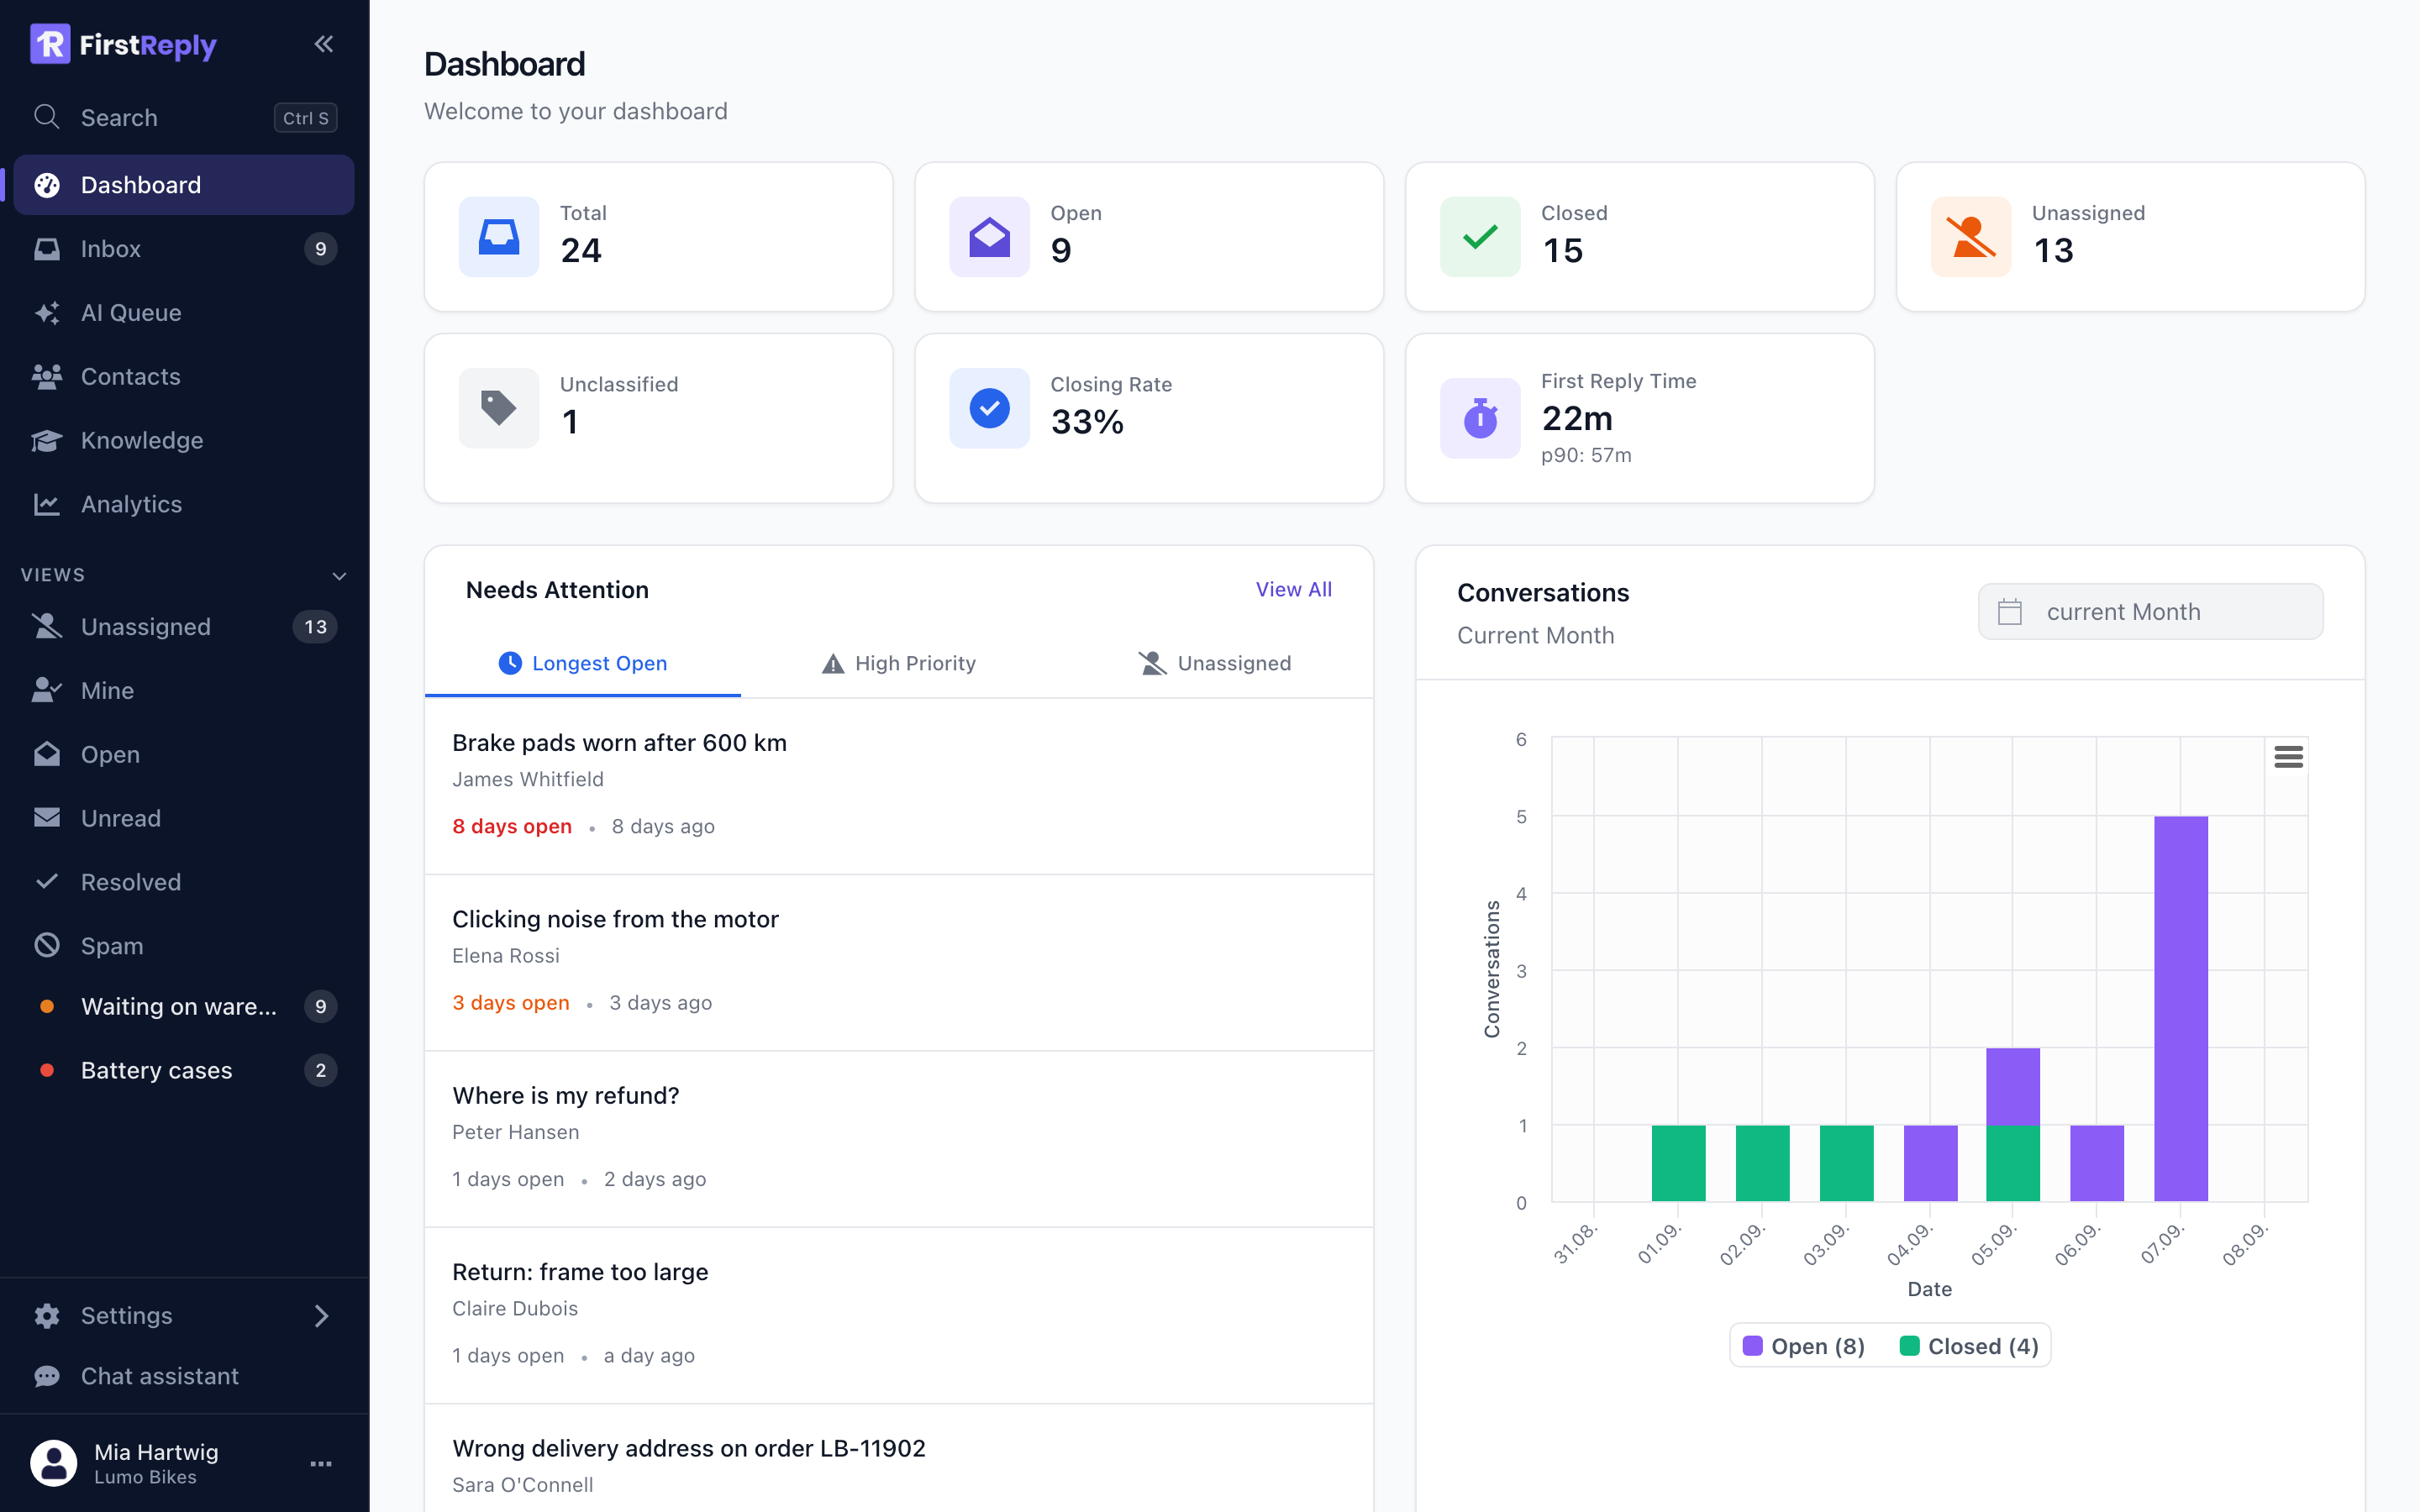
The numbers
Total — conversations in the selected period.
Open — not closed. This is the size of the queue.
Closed — finished in the period.
Unassigned — open with nobody responsible. The number to keep near zero; everything in it is work nobody has picked up.
Unclassified — the assistant could not categorise them. A few is normal, a lot means your classification catalog has a hole.
Closing rate — the share of conversations that were closed. Read it together with the reopen rate: closing fast and reopening often is not progress.
First reply time — the median time from a customer's message to your first reply, with the 90th percentile underneath. The p90 is the honest number: it tells you how long the unlucky customers waited, and it is the one automation moves most.
Needs attention
Three tabs over the conversations most likely to need someone:
Longest open — oldest first. Anything that has been sitting for weeks is either forgotten or genuinely blocked, and both deserve a look.
High priority — priority High or Critical, including everything the assistant handed over.
Unassigned — waiting for someone to take it.
For a working queue rather than an overview, use the AI Queue: it groups by why a conversation needs a person, which is more actionable.
Conversations over time
New and closed conversations per day for the selected period.
What to look for is not the height of the bars but the relationship between them. Closed tracking new means you are keeping up. New consistently above closed means the backlog is growing, whatever the totals say.
Change the period with the selector above the chart.
Where to go next
The dashboard is deliberately shallow. For anything about how well you are doing rather than what is currently on the pile, use Metrics, which covers closing rate over time, reply times, the share the AI handles and customer sentiment.